
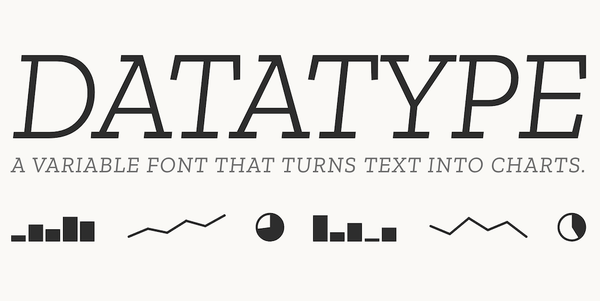
This month, I’m sharing a clever typeface that turns simple bits of text into compact bar charts, sparklines, and pie charts, with no JavaScript, images, or charting library required: Datatype. It is an especially intriguing option for adding lightweight data visuals to web pages, tables, dashboards, or reports while keeping everything right in the flow of the surrounding text.
Do you have any tips or tricks for creating graphs and charts? Or do you have any special fonts that you like to use for specific purposes? Please share in the comments below!
Have a cool app, tool, or tech tip you’d like to share? Contact Chase Masters. Please note that Tech Tips are personal recommendations and might not be officially endorsed or supported by the University of Michigan.


