
 ITS Teaching and learning (T&L) is partnering with the School of Information (SI) and the School of Education (SOE) to develop learning analytics tools aimed at improving student performance. Equipped with evidence from past learning dashboard efforts, research faculty and graduate students in SI and SOE have been working with development staff from T&L on designing —and then ruthlessly critiquing —a series of rapid prototypes. These prototypes are aimed at visualizing learning data in a way that students can use to inform improvements to their study behaviors. This process resulted in the My Learning Analytics (MyLA) service being piloted in three courses in fall, 2018.
Embedded visualizations
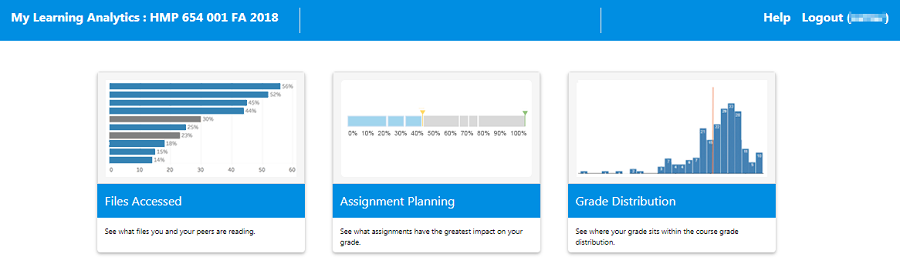
MyLA includes three data visualizations to support student learning and engagement with courses that are embedded within the normal instructional workflows of Canvas:
- The Files Accessed visualization displays which files peers are accessing each week.
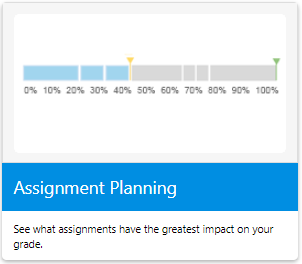
- In the Assignment Planning visualization, students can glean which assignments have the greatest impact on their grade, when assignments are due, and how far they have progressed through the assignments.
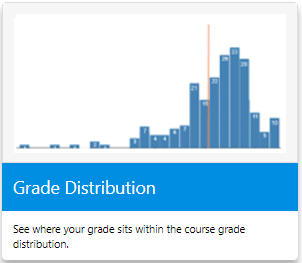
- Finally, a Grade Distribution visualization shows them their performance in comparison to their peers.
Supporting research in student learning analytics
U-M has long been a leader in learning analytics. For this project, ITS Teaching and Learning partnered with faculty researchers Stephanie Teasley, Matthew Kay, and graduate student Carl Haynes from UMSI and faculty researcher Stuart Karabenick from SOE. Acknowledging that student dashboards are becoming ubiquitous in learning management systems, the researchers recognized the need for research into how students understand and apply the information in those dashboards. They want to know if students are able to interpret the information dashboards provide and if they know what to do with it. Also, they question which students find the information motivating versus demotivating and under which circumstances.
With My Learning Analytics, the research team will survey students and track their usage to begin to answer those questions as they study student use of the dashboard to uncover correlations between use of analytics and changes in student behavior leading to improvement in student outcomes.
Building on the UDP
Beyond its research goals, MyLA provided developers an opportunity to build a service that consumes data from the new Unizin Data Platform (UDP). U-M partnered with the Unizin consortium to develop a unified learning data platform that ingests and commonly models data from multiple sources, such as the student information system, Canvas learning management system, and online learning tools.
Next steps
The project team has begun to review initial usage statistics and feedback from one pilot course. In anticipation for the winter 2019 pilot, they are looking for additional participants. Anyone interested in learning more about My Learning Analytics can contact the project team at [email protected].
![]() John Johnston, ITS program manager, contributed to this article.
John Johnston, ITS program manager, contributed to this article.