
(Jowei Chen)
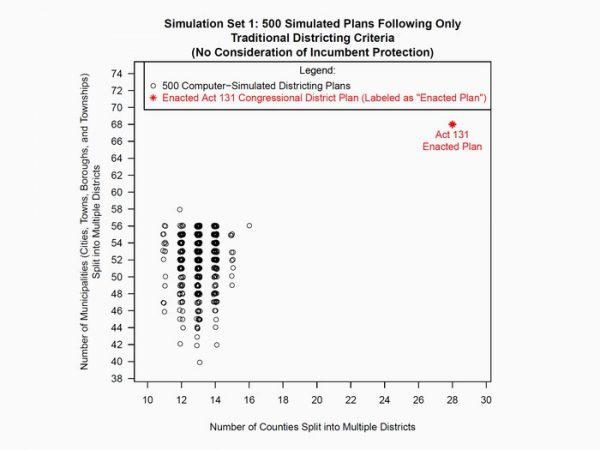
Pennsylvania’s congressional map was among the most gerrymandered in history. Experts like LSA political science professor Jowei Chen used data analyis and computer modeling to help change that situation. Chen’s computer programs create alternative maps based on a series of geographic constraints: maps that are compact in shape, preserve county and municipal boundaries, and have equal populations. They’re drawn, says Chen, to be “geographically normal.” Chen generated 500 such maps for Pennsylvania, and analyzed each of them based on how many seats they would yield for each political party. He compared those figures to the disputed map, and presented the results to the court. In February, the Pennsylvania Supreme Court issued a brand new congressional map to replace the one Chen and other experts testified about. Chen has provided expert testimony in a litany of redistricting cases, including in North Carolina, where judges relied heavily on his testimony in their decision to overturn the existing map.