
Information Quest (IQ) in ITS and the Office of Budget and Planning (OBP) in the Office of the Provost have partnered and launched two new dashboards this fiscal year: University Metrics and Michigan Metrics.
University Metrics
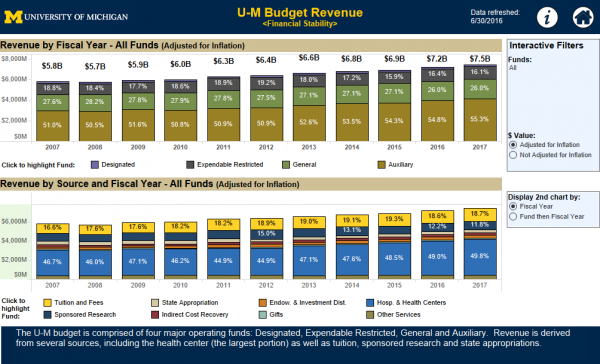
In July 2016, the Office of the President presented IQ and OBP with a request: create a series of visual dashboards on key metrics identified by the President and provost. These dashboards will be used by the president, provost, regents, and other executive officers to view metric trends. IQ and OBP partnered to create the first president’s/leadership dashboard using Tableau, a data visualization software. Using IQ’s expertise in Tableau and OBP’s expertise with university data, along with data assistance from other groups on campus, the project team created about half of the requested 60+ dashboards for the first phase of the project delivered at the October 2016 regents meeting.
Data for the dashboards came from a variety of sources, from data warehouses to externally collected data residing in Excel spreadsheets.
Development continues on the remaining dashboards, which require the team to identify data sources, and, in some cases, to gather data not previously available. Several of these will be available at the end of June 2017 and the others when the data become available.
Michigan Metrics
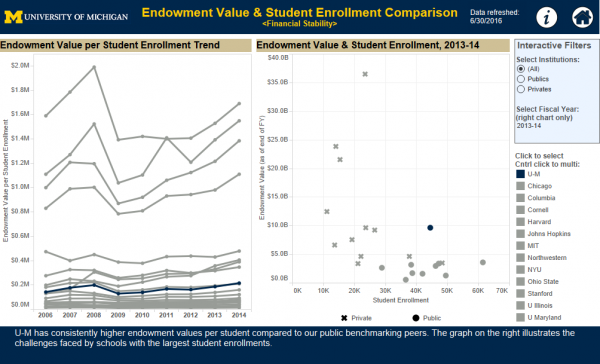
As the first phase of the University Metrics project completed, the provost’s Office of Budget and Planning requested assistance with a new venture—converting an annual, decades-old paper/PDF report process with a new dashboard suite. These paper reports, referred to as “Data Displays,” contained critical data points used by schools and colleges and other units to inform budget development and management. The goal of the conversion was to provide a means to utilize data in an interactive way to provide richer information for planning. As a result, these dashboards serve a broader audience across the university by providing trusted, consistent, and readily available data.
IQ worked on site for three-and-a-half months to support the effort, converting PDF reports of pivot tables into a dashboard suite designed to more easily see trends and to present data. OBP staff contributed many hours co-developing and validating the data.
Advanced features of Tableau were used to allow users to filter and display in a variety of ways. For example, in the chart “Fall Student Enrollment” the “Stack by:” and “Split by:” options allow the user to change the display and explore the data.
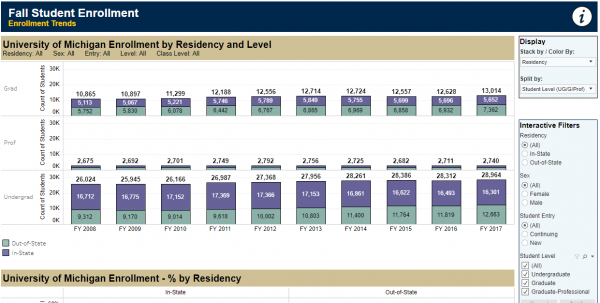
View 1: by residency and level
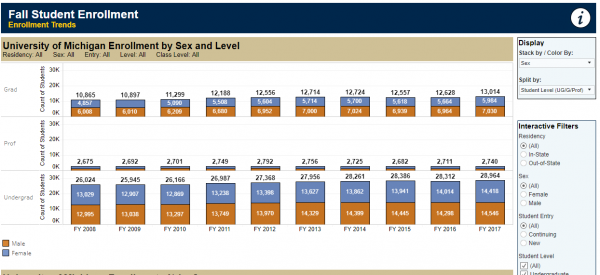
View 2: by sex and level
In April, the Michigan Metrics suite was presented at several Budget Administration Group meetings. Since the launch, these dashboards have been accessed nearly 2000 times by 75+ distinct users.
To publish these dashboards, and to help with future university-wide metrics projects, metrics.umich.edu was created with assistance from the ITS Web Team. This new portal allows people to log in to the website and displays dashboards based on their individual access rights.
Future enhancements of Michigan Metrics include creating a high-level overview dashboard designed for VPs, deans, and senior leadership in schools, colleges, and units; creating a non-academic unit dashboard set; and adding in the ability for dashboards to view down to the department level within SCUs.
The metrics website will continue to evolve as new projects come online and its vision and scope are currently in discussion.